1. Transcription
Transcribing London House was by far the most time-consuming step in the process, taking well over half of the scheduled duration. The main perpetrator of this delay was the handwriting used to compose London House, which was often difficult to decipher and, at times, verged on illegibility. One great aid in this process was the high-quality digitization provided by The Folger Shakespeare Library, which allows readers to magnify the pages while maintaining readability. This allowed for the ability to focus on words causing particular issues and, if needed, to transcribe a line word by word.
However, before a whole transcription could be created, it was necessary to decode and translate antiquated words to properly understand the composition of London House. This was first done by deciphering the four categories listed at the top of every page: Venit, Expense, Valet, and Remanent. Luckily, this proved to be a relatively painless part of the process, as we hypothesized from the beginning that “remanet” has some correlation with the word “remainder,” and that “expence” either referred to the amount spent or the items used. Thanks to Professor LoPiano’s knowledge of Latin, he was able to translate “Venit” as “he comes/arrives,” which we took to mean the food had arrived or was being delivered to the house. This left “Valet” as the logical category for the value of items used.
 A close up of the four categories from London House
Following this, it was necessary to decode the numbers used within the text. The numeric system was fairly straightforward, consisting mainly of Roman numerals, except for weekly and monthly summaries, which are written with Arabic numbers. However, the inconsistencies with which the numbers were written made transcribing difficult. For instance, “i” was rarely consistently dotted, making it hard to know when the author was writing multiple “i’s” in a row, or attempting to write a different number. Some numbers were also written in the author’s own style, which was not in line with standard Roman numerals, such as 4, which was always written as “iiii” instead of “IV.”
 4 pence written without dotted i’s
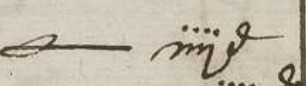 4 pence written with dotted i’s
The final step in decoding was understanding the types of currency being used. After much deducing, we decided that, based on the current symbol for pound, lb, the “L” used might be an earlier iteration. After this, we were finally able to decipher the second currency symbol as a “d,” which, after some research, we discovered was the symbol for “pence.” There were also a few less common forms of measurement that took getting used to, such as “stone,” used exclusively for beef; “joints,” for lamb and mutton; and, occasionally, “firkin,” for butter.
2. Data Collection
Based on how long it was taking to decode and transcribe the text, it was unrealistic to collect data on every food mentioned within London House in a given week. Instead, I chose to transcribe a smaller number of foodstuffs that I felt best reflected general consumption patterns. This required leaving out more antiquated foods like “cheate” or “manchette” and focusing instead on 4 central categories: Dairy, Meat, Fish, and Poultry. These foods were chosen because they were staples that appeared on a weekly basis, are easily transferable to our understanding of food culture today, and are broad enough to still show significant consumption trends.
After these categories were decided, the data collection categories themselves needed to be chosen. The goal was to format the excel sheet, where the data would be collected, in a consistent manner easily readable by the data visualization tools later employed. Considering these factors, the excel sheet was formatted with the categories of : week, food, amount purchased, amount used, monetary value, and unit of measurement.
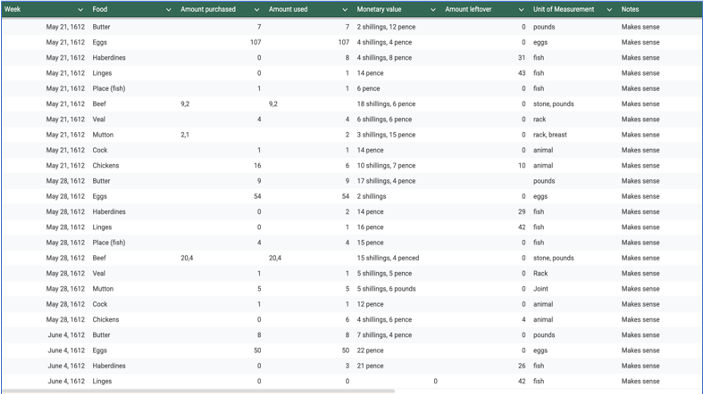 A photo of the original data sheet
3. Data Visulaization
The data visualization tool applied to _London House _was Tableau. After surveying different options, Tableau proved the most favorable as it has a straightforward application, allows for interactive elements, and provides immense opportunities for customization. Although the data was curated to be readable for Tableau, it did require some additional cleaning before it could be properly applied. This cleaning mainly revolved around standardizing measurements, creating broader categories for the food, and doing some additional math to adjust the monetary values based on today’s currency. Once this was done, the data was applied to Tableau where a variety of different data visualization tactics were applied to it, as shown in the “Results” section of this webpage.